Oklahoma Bridge Tracker
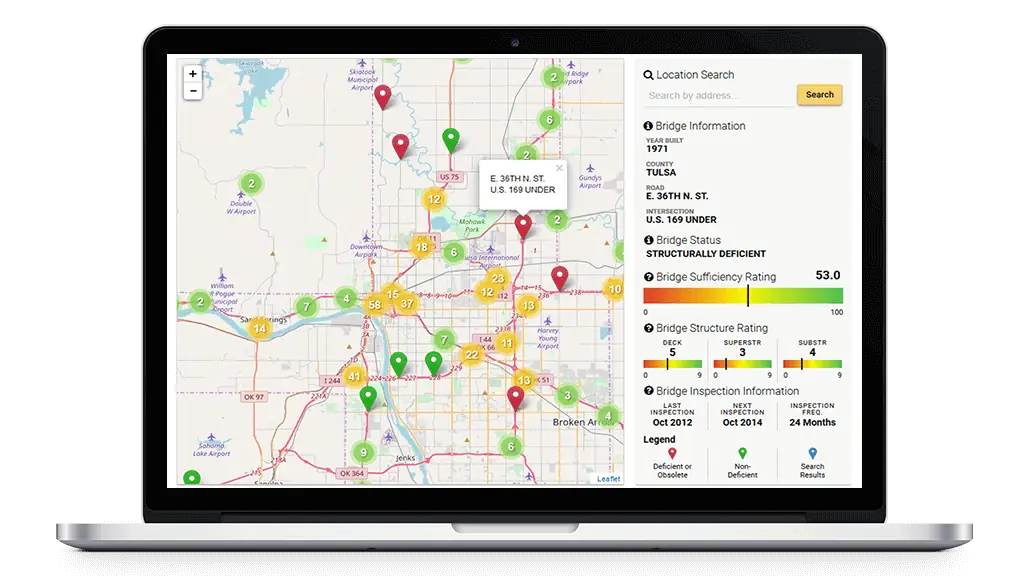
NewsOn6 content directors were working on an investigative on-air sweeps story to expose dangers Oklahomans faced on their daily drive over failing bridges. Our team was approached to create an interactive mapping feature to accompany the story.
Functional requirements included:
- Display information and current structural condition on each bridge in the state
- A search feature allowing users to search areas and addresses
- A detailed legend explaining the map and information provided by the Oklahoma Department of Transportation and the Oklahoma Turnpike Authority
Background
The stability and safety of Oklahoma's nearly 7,000 bridges have become a significant concern for the state’s residents and authorities. The Oklahoma Department of Transportation (ODOT) conducts regular bridge inspections, revealing various bridges in deteriorating conditions. These findings indicate potential dangers for daily commuters, prompting NewsOn6 to prepare an investigative on-air sweeps story to expose the risks associated with these failing structures.
Problem
Oklahomans face potential hazards due to the poor condition of many bridges they traverse daily. The current state of bridge health information is not easily accessible to the public, leading to a lack of awareness and understanding of the risks involved. This gap in information makes it challenging for residents to stay informed about the safety of the infrastructure they rely on.
Need
There is a need for a centralized, interactive platform that provides accessible, up-to-date information on the health and status of Oklahoma’s bridges. Such a solution should integrate ODOT bridge inspection data and present it in a user-friendly format to inform and engage the public about infrastructure safety.
Solution
Using ODOT bridge inspection data, an interactive state map was created that showcases the health of Oklahoma’s bridges. The map accompanies NewsOn6’s investigative story, offering a visual representation of bridge conditions. The map aims to enhance public awareness and understanding, allowing Oklahomans to easily navigate and identify the status of bridges in their area. By providing this comprehensive, intuitive interface, Bridge Tracker will support informed discussions and encourage proactive measures to address infrastructure challenges.
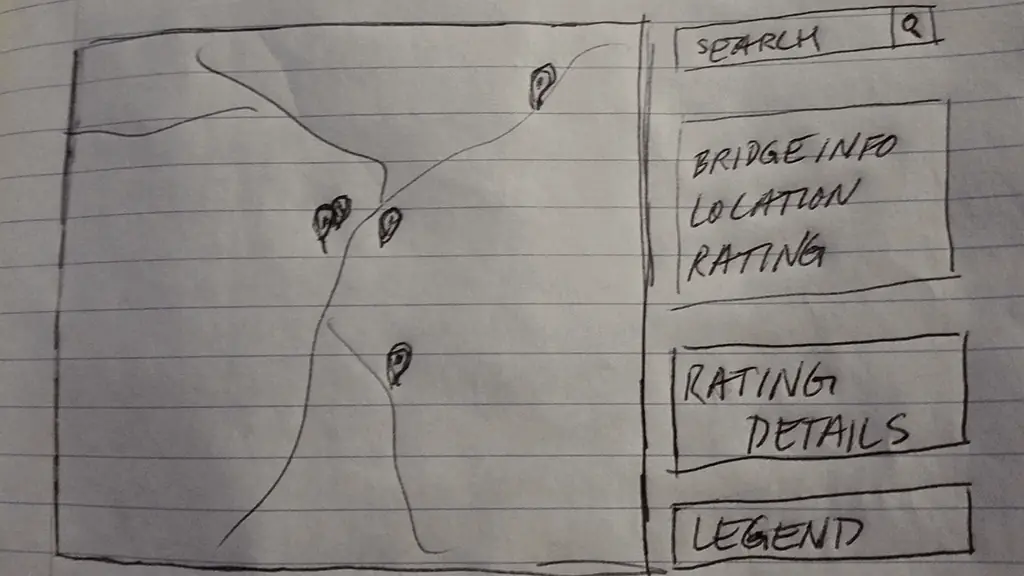
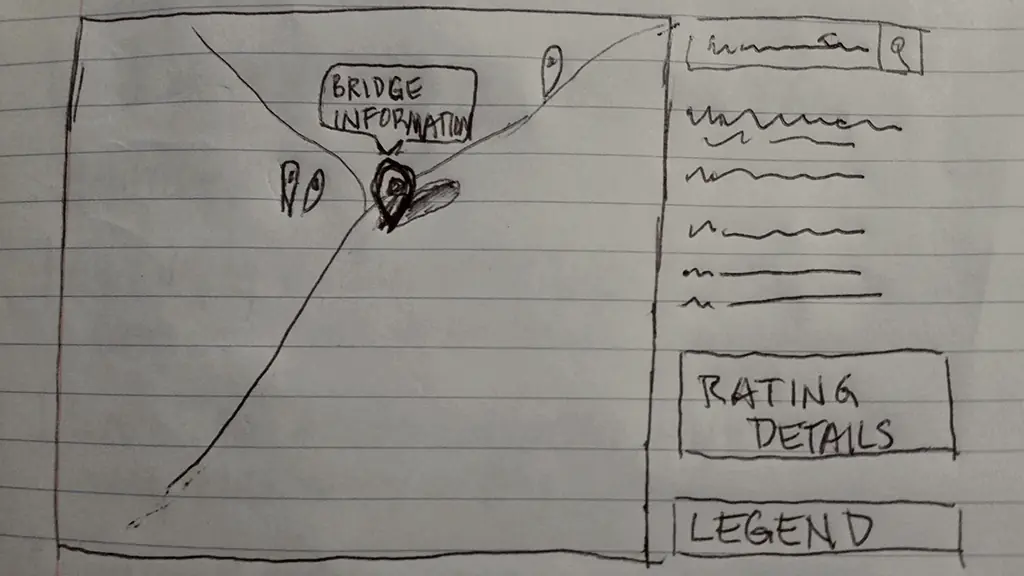
Working from the functional requirements provided to our team, a comparative analysis was performed to determine what products and/or services existed in this interactive space. During this research, we determined a product of this nature did not exist. Following the analysis, the team began brainstorming data sources, exploring design directions and necessary technologies to bring this idea to market.
After reviewing mapping products, we determined we were unable to use Google Maps API for commercial use and decided on Leaflet for its ability to handle large amounts of data, as well as many feature-rich plug-ins. One of the plug-ins used was the Marker Clustering plug-in, which was crucial in providing a good user experience by clustering bridge together at different zoom levels. This prevented the user from being bombarded by hundreds, if not thousands, of location pins upon map load.
During the build phase, several issues surfaced, one of which was the transformation of data on the client side from address to latitude/longitude causing performance problems. To resolve this, a programmatic process was written leveraging a geo-location transformation service. This allowed us to pre-process the addresses and convert them before giving the data to Leaflet.
Upon launch, there was a huge and positive public response, resulting in emails from website users and the viewing audience expressing their appreciation for exposing an issue they feel their leaders have left unaddressed. Additionally, users spent an average of five minutes on the Bridgetracker interactive map.

Conclusion
This project became a giant win for Oklahomans. This investigative expose and interactive map brought public attention to the glaring structural deficiencies of bridges across the state, encouraging the state to respond with plans to improve bridge safety.


